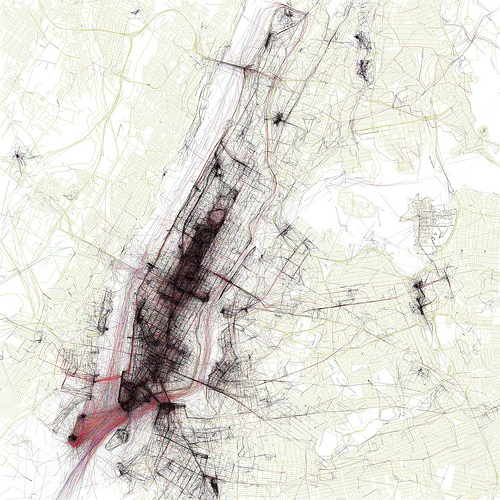
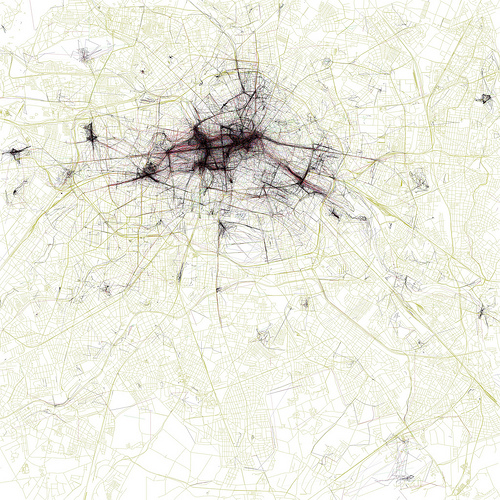
Bei Blank (Media) Slate bin ich auf etwas Interessantes gestoßen: Eric Fischer hat 100 Stadtansichten erstellt, indem er Bilder von Foto-Plattformen genommen und deren Geodaten mit Karten von OpenStreetMap kombiniert hat:
To create this image of San Francisco …, he took the geo-tagged data from photos uploaded to Flickr and Picasa, then banged the locations against OpenStreetMap using Perl and Ghostscript to overlay travel vectors of the photographers. Specifically, he compared photos taken by the same photographer within 10 minutes and bounded by 3 miles to compute and plot their travel vector. The resulting map is color-coded to indicate black=walking (7mph), red=bicycling (19mph), blue=street vehicles (43mph), green=freeway vehicles or rapid transit (>43mph).
Hier zwei Beispiele: New York und Berlin


Bildquelle: CC-Lizenz (CC-BY-SA)

